Processing and visualizing diagnostic data
Me and my friends, Paul Lackner and Nina Moritz, had the opportunity to complete our diploma thesis at Vexcel Imaging. We are extremely thankful that we got to do this and we gained a lot of knowledge – not just technical knowledge, but knowledge about writing scientific papers, as well. I responsible for frontend with a focus on performance optimization and I also got to be the project leader, putting me in charge of project management.
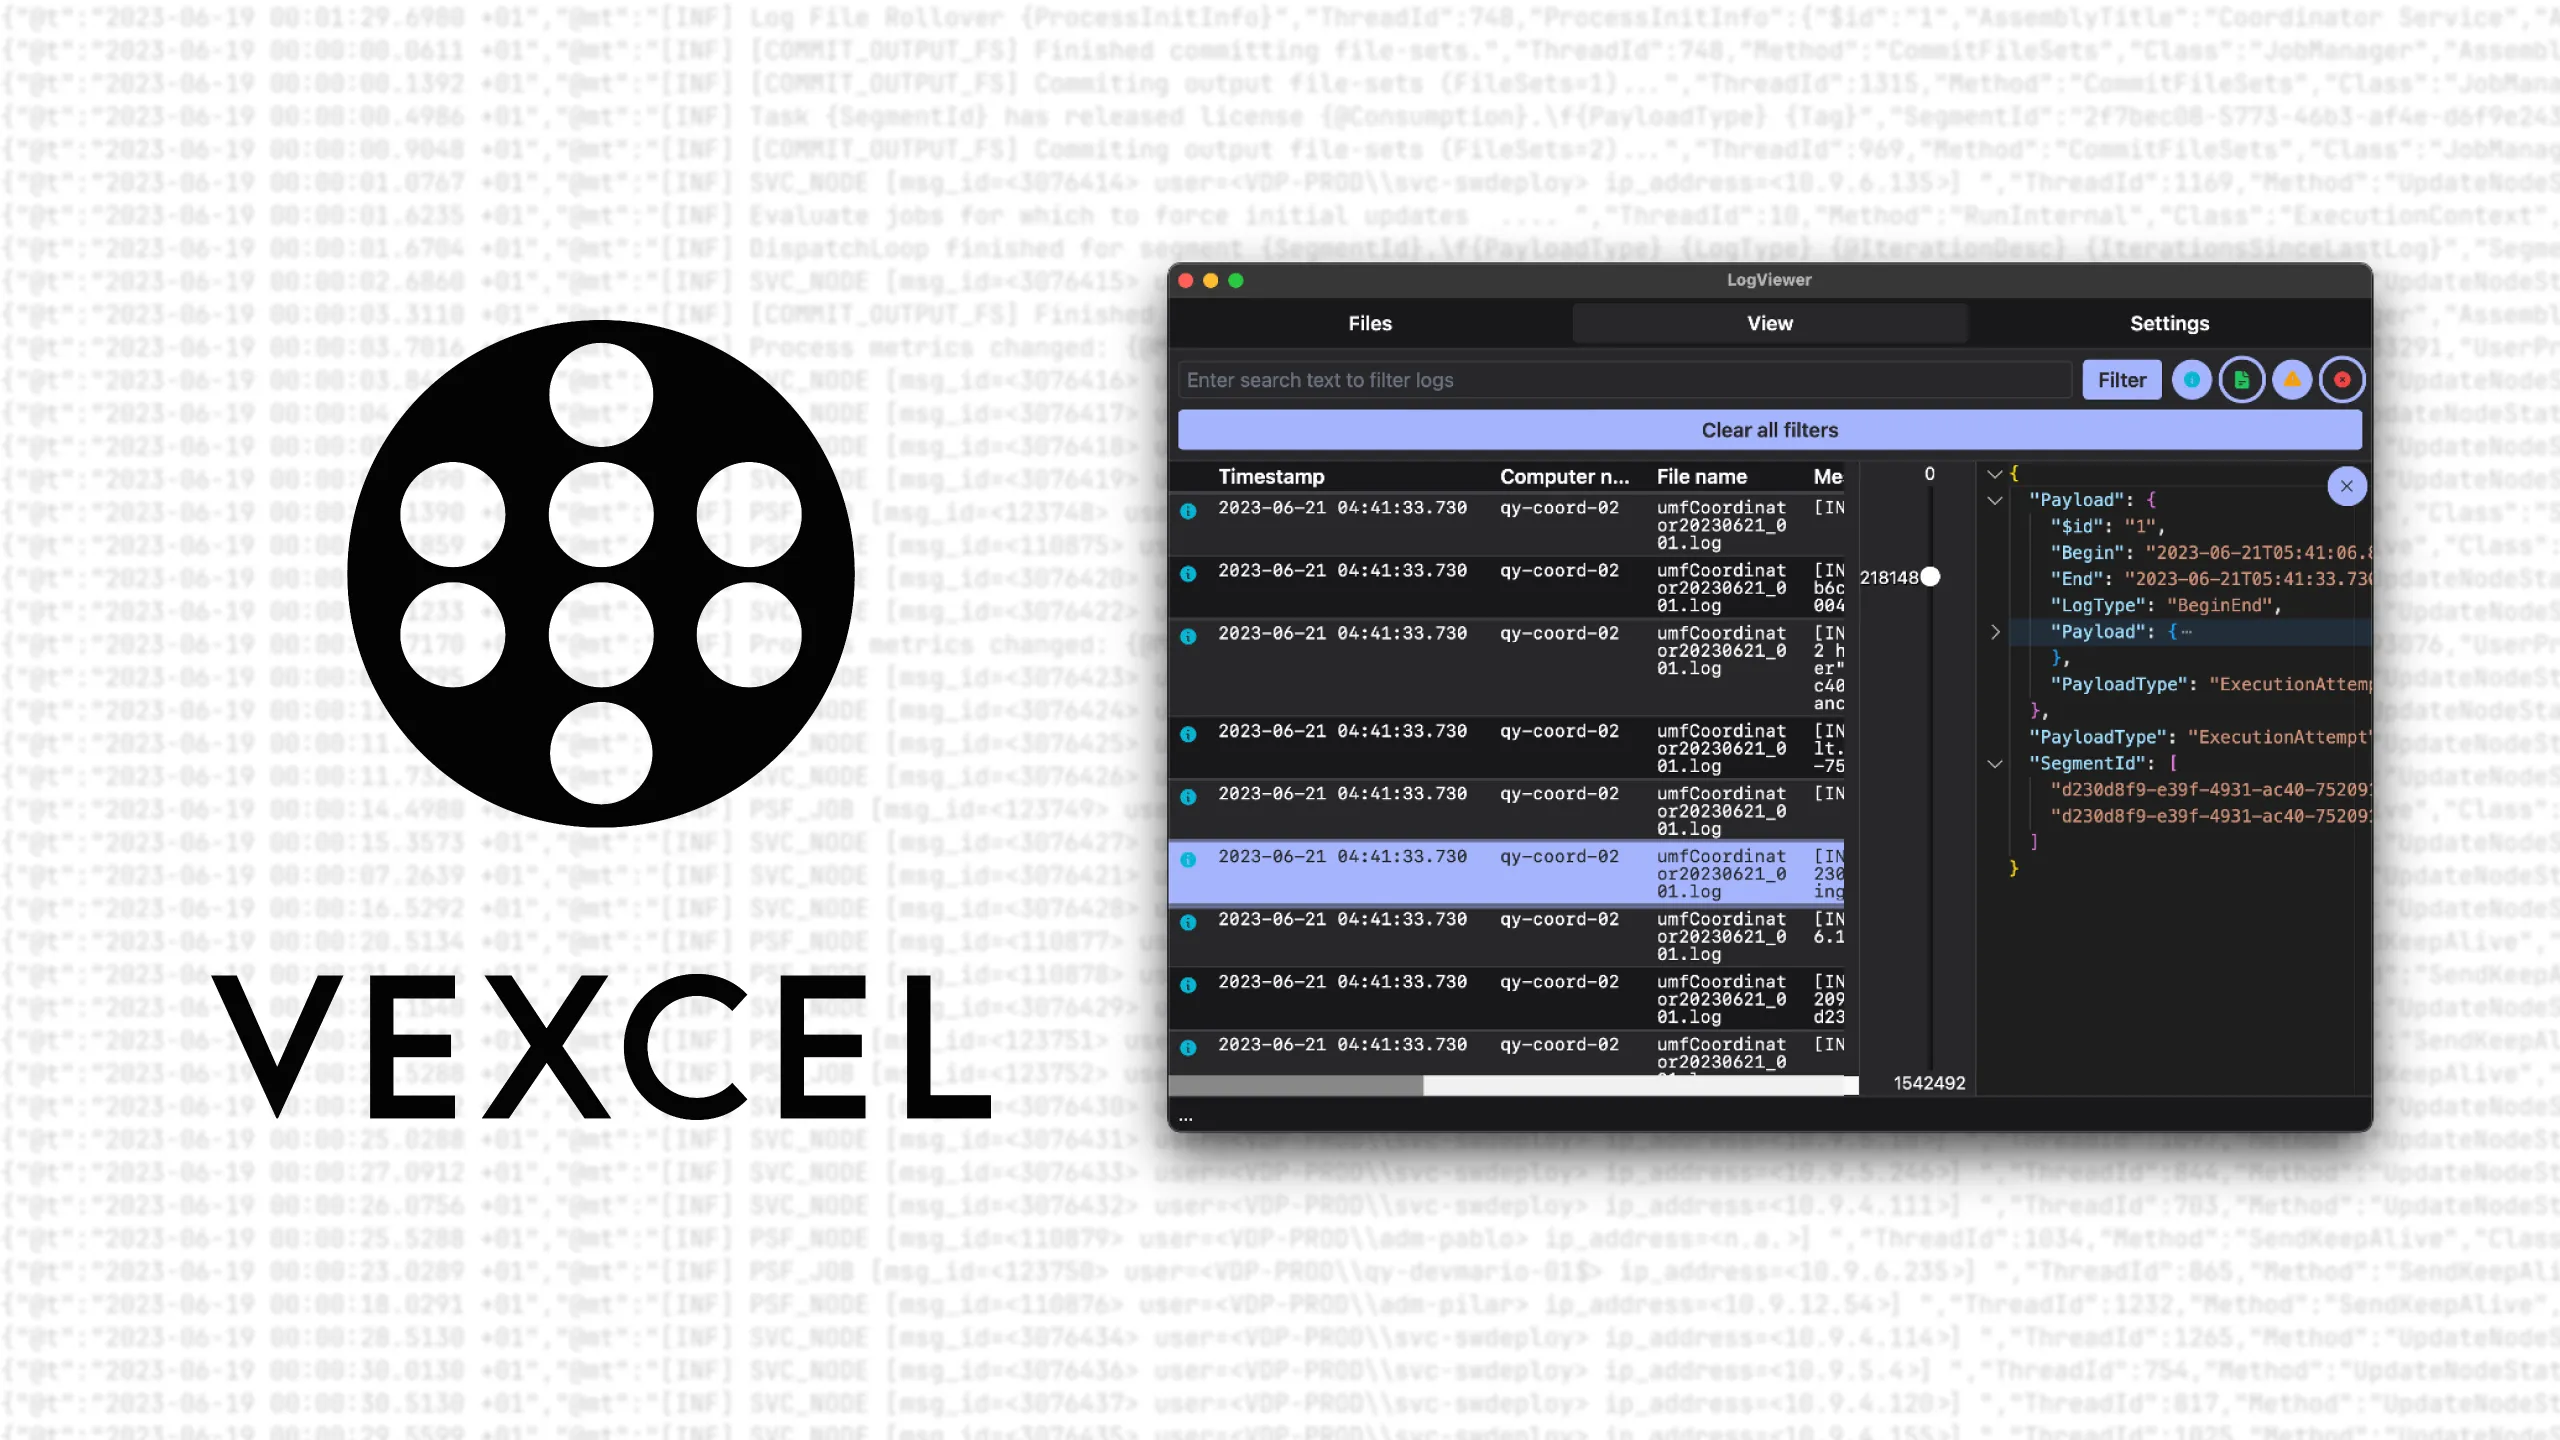
With computing systems of our day getting more and more complex, the amount of possible failures any of these new systems can have has also increased starkly. Such complex systems therefore need to produce a vast amount of diagnostic data, so that failures are detected and dealt with swiftly. But with the sheer amount of data produced, tooling to process and visualize this data needs to adapt to an array of new challenges.
Vexcel Imaging, a global leader in Aerial cameras, mapping systems, and photogrammetric processing software located in Graz, ran into this exact issue. As they were expanding, what information is logged by their processing software, the application used to identify problems in these logs was struggling with the increased data to the point of becoming unusable.
In order to tackle this issue, we created a new application is able to cope with amounts of data orders of magnitudes greater than what was grinding the old solution to a halt. Being developed from the ground up, we not only were able to completely rework how the data is processed and visualized, but also had the opportunity to use a highly modern tool set.
While the main goal was to create an application that can cope with this mass of data, we also made an effort to give a great user experience with a wide range of features. This thesis will gives a thorough explanation on how we implemented the features our application provides. Moreover it also provides a more abstract analysis of the major concepts and tools we used.